
You can’t manage what you don’t measure. Today, we’re excited to announce the release of the Rafflecopter Analytics dashboard: analyze your giveaway’s analytics like you’ve never been able to before.
With the new Rafflecopter Analytics, you’ll be able to gain more insight into your giveaway’s traffic & where it’s coming from, see how your giveaway is performing across various sites (super useful for if your widget is embedded in multiple locations), gather insight into your entrant’s demographics, what devices they’re using to enter your giveaways, and a handful of engagement metrics based on entry options you’ve selected.
This is a feature available on the premium subscription plan. Below, we’ll give you a tour of the new analytics dashboard and the information you’ll be able to access.
Accessing Your Analytics
To access your new analytics dashboard, sign into your Rafflecopter account and navigate to any of your giveaway’s setup, installation, or entries tab. At the top of the page you’ll see a ‘new’ graph icon in your giveaway’s title bar that looks like a bar chart.
Real-Time Analytics
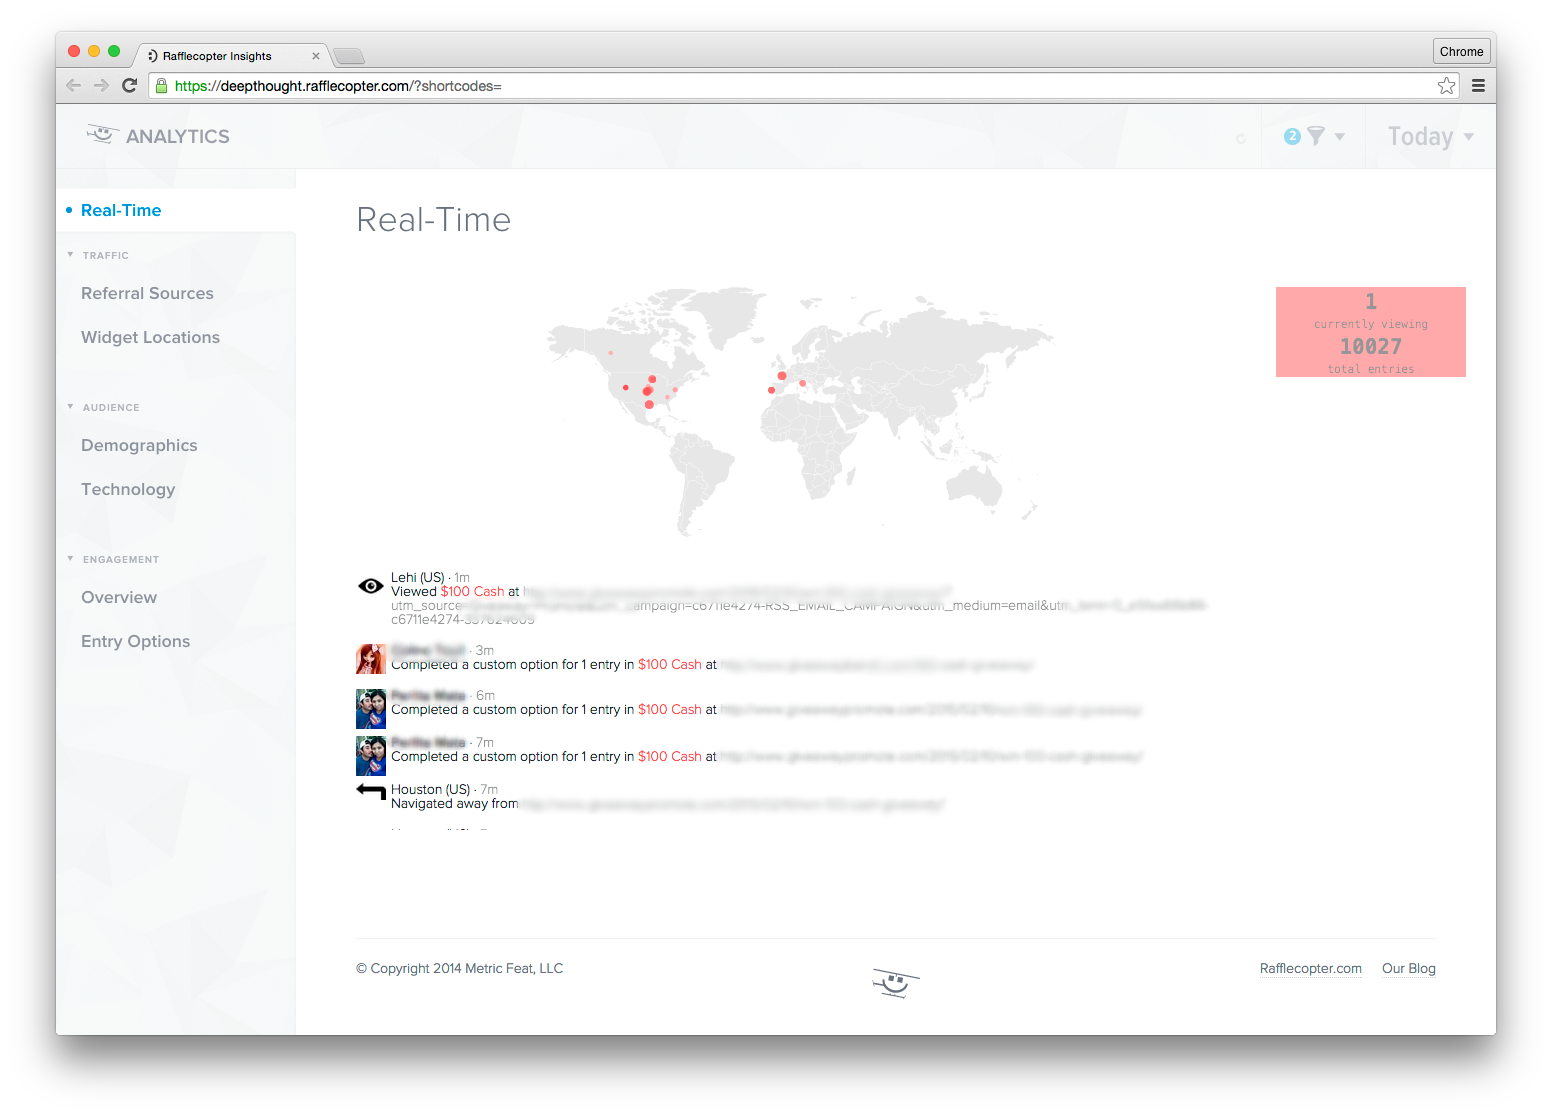
When you land on your analytics dashboard, you’ll be placed into the real-time analytics page. Here you’ll be able to see entries coming into your giveaways the second they happen. The world map will also show you where entries are coming when they happen. This page serves as the main dashboard page.
Your Giveaway’s Traffic Breakdown
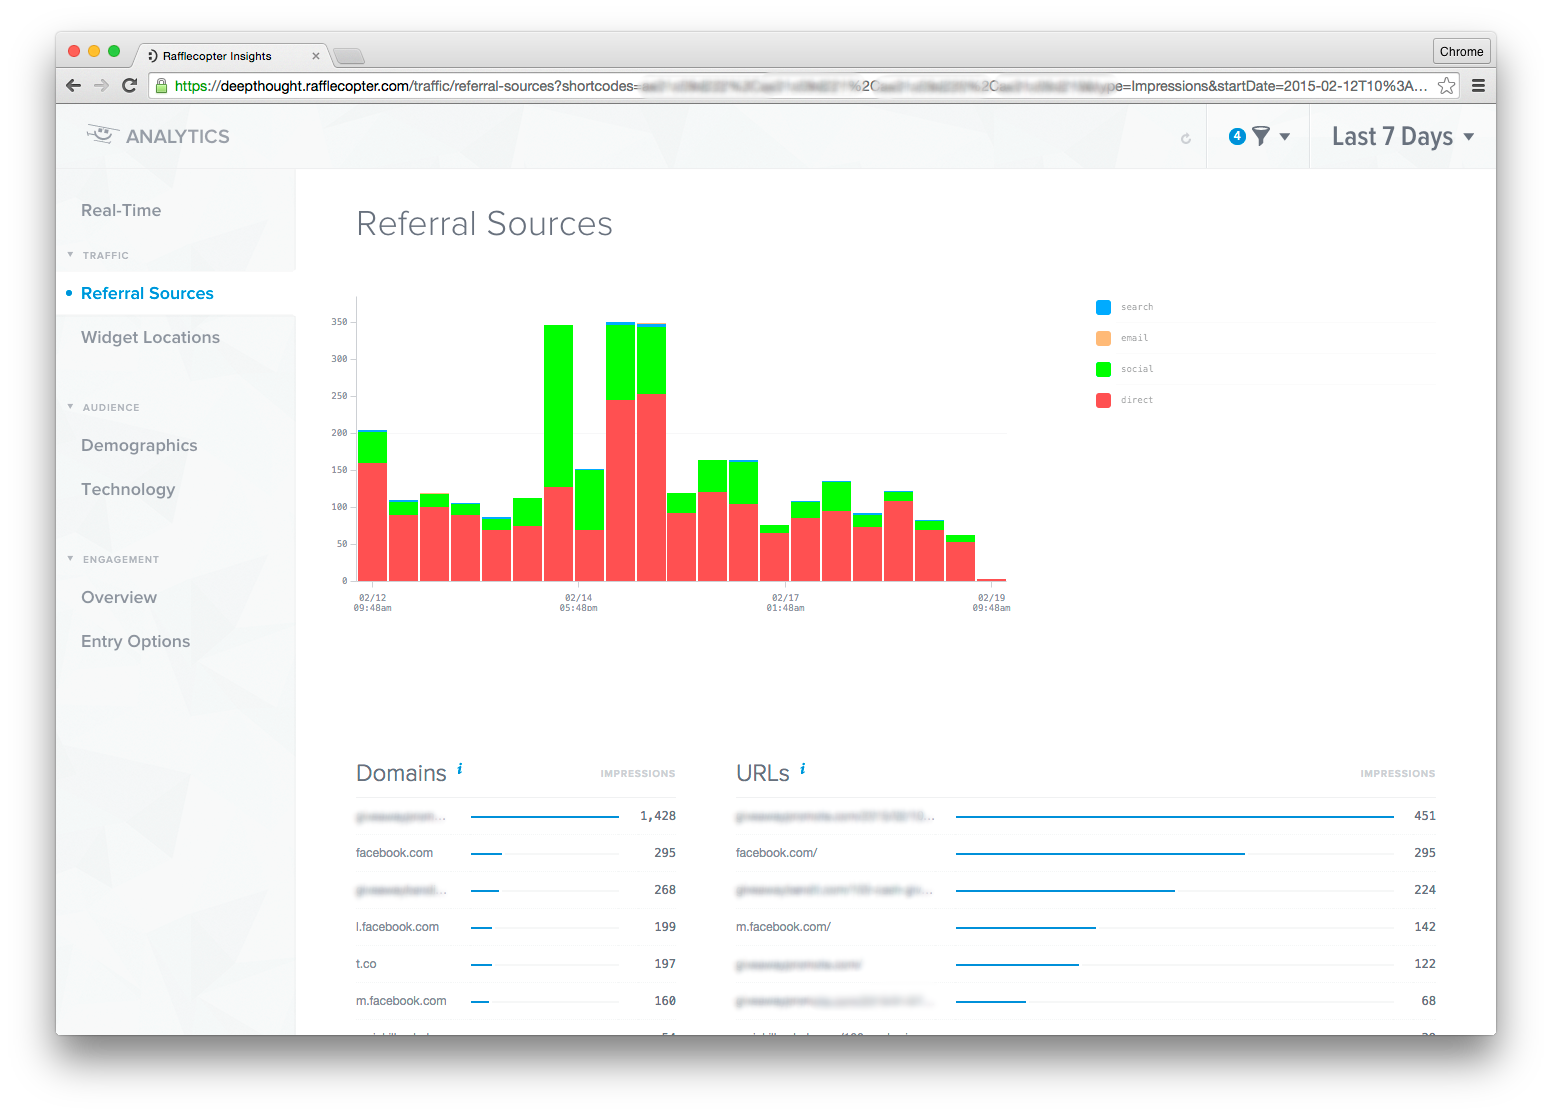
Referral Sources. See where your giveaway traffic is coming from. You’ll be able to breakdown your giveaway by the domains & URLs your visitors came from as well as what channels have been driving traffic to your giveaways (direct traffic, social, search, email, etc).
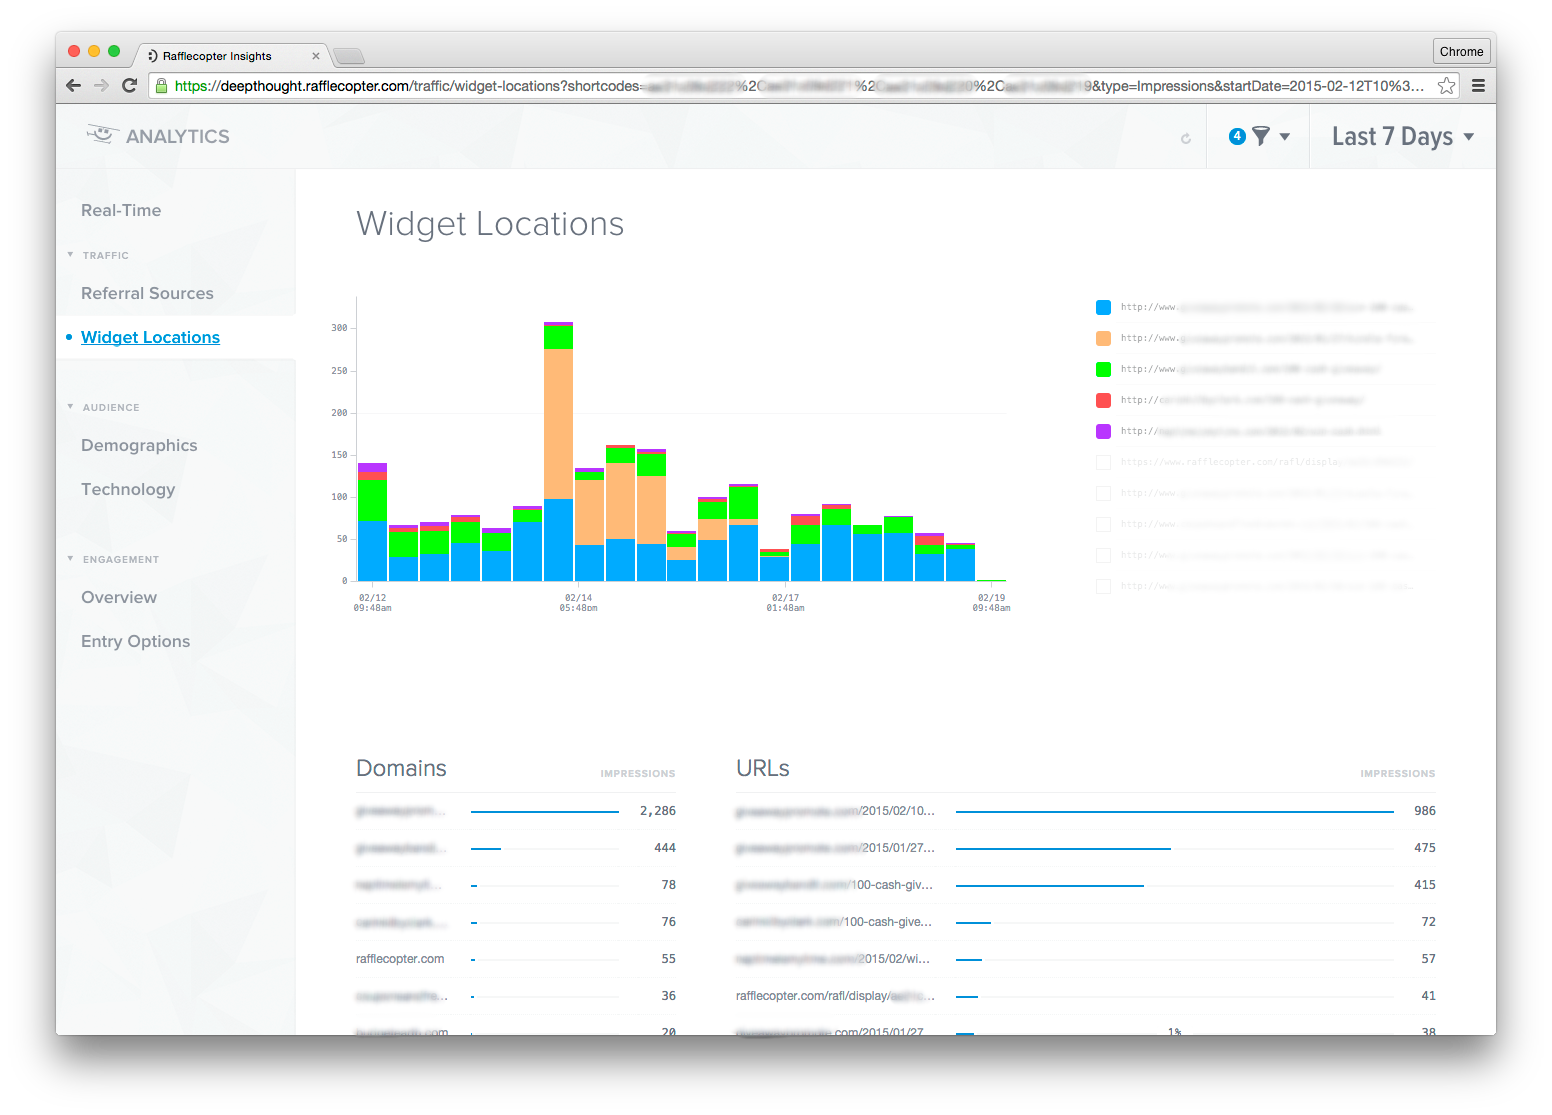
Widget Locations. If your giveaways are embedded in multiple locations, you’ll be able to see a breakdown of traffic each widget receives.
Your Giveaway’s Audience Breakdown
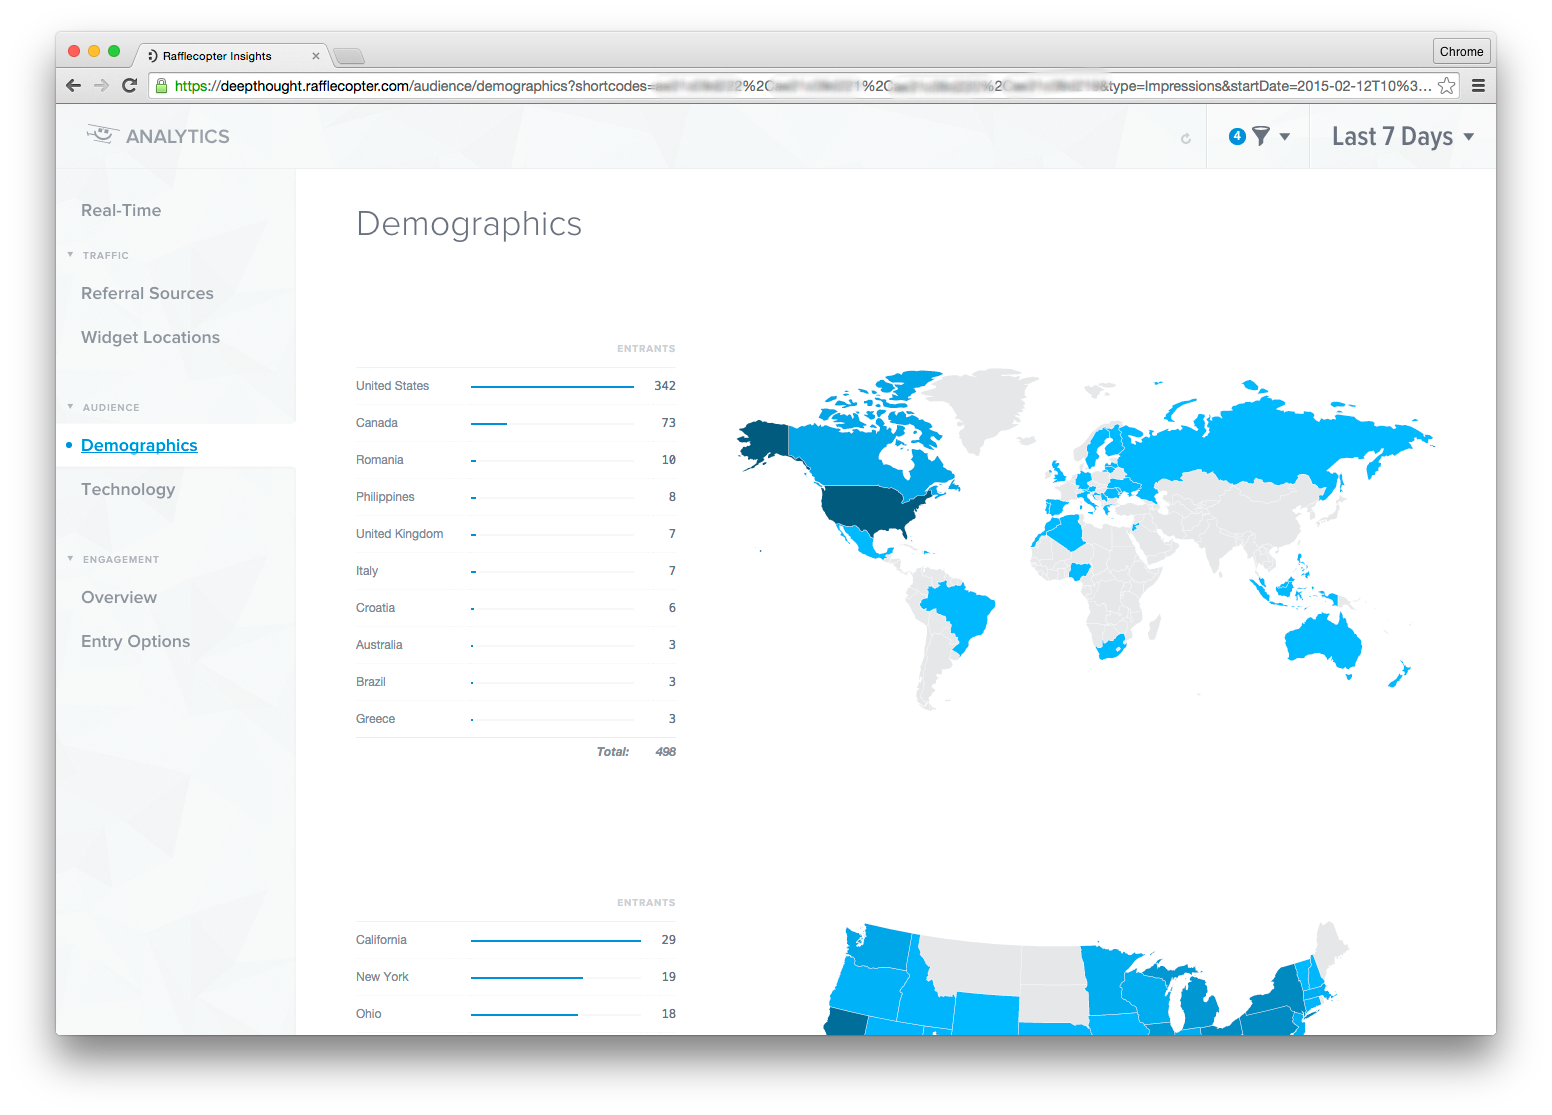
Demographics. Breakdown your giveaway entrants by their country and state they’ve entered from. Additionally, see the top ten most popular cities entrants are arriving from and top ten languages spoken by your entrants.
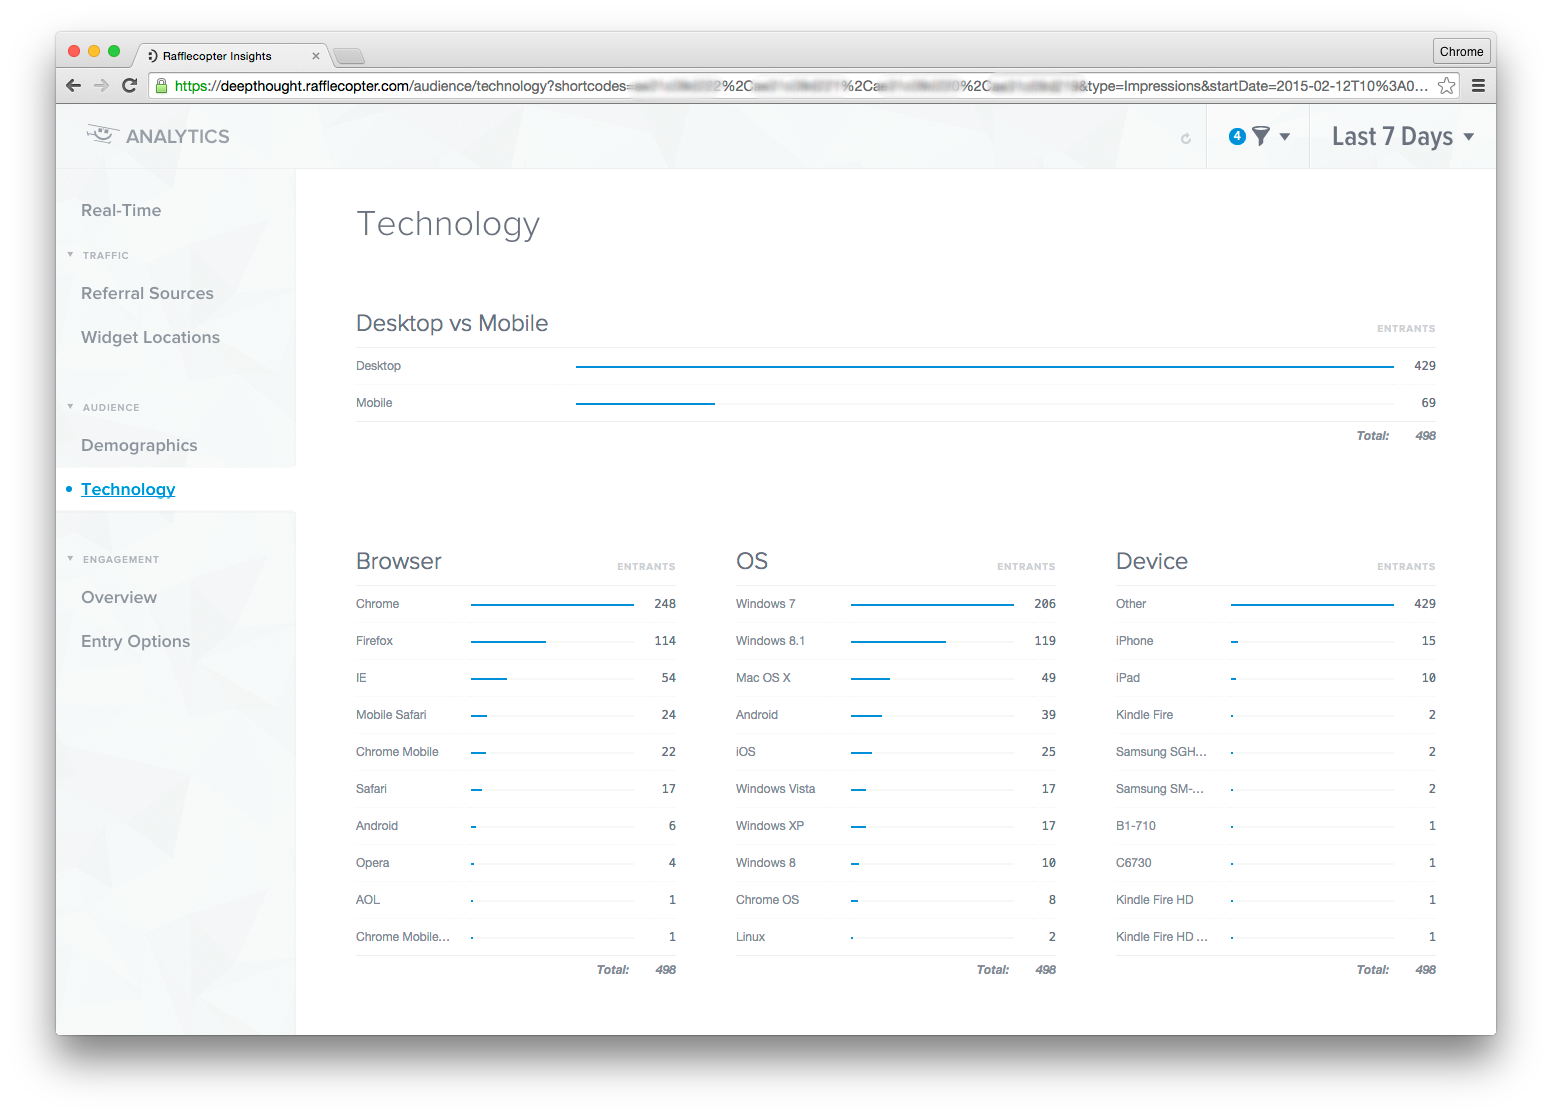
Technology. Get an overview of your entrant’s devices (desktop vs mobile), popular browsers, and operating systems.
Your Giveaway’s Engagement Breakdown
Engagement overview. Get a general overview of your giveaway’s entries by time of day, referral sources, widget, locations, and channels.
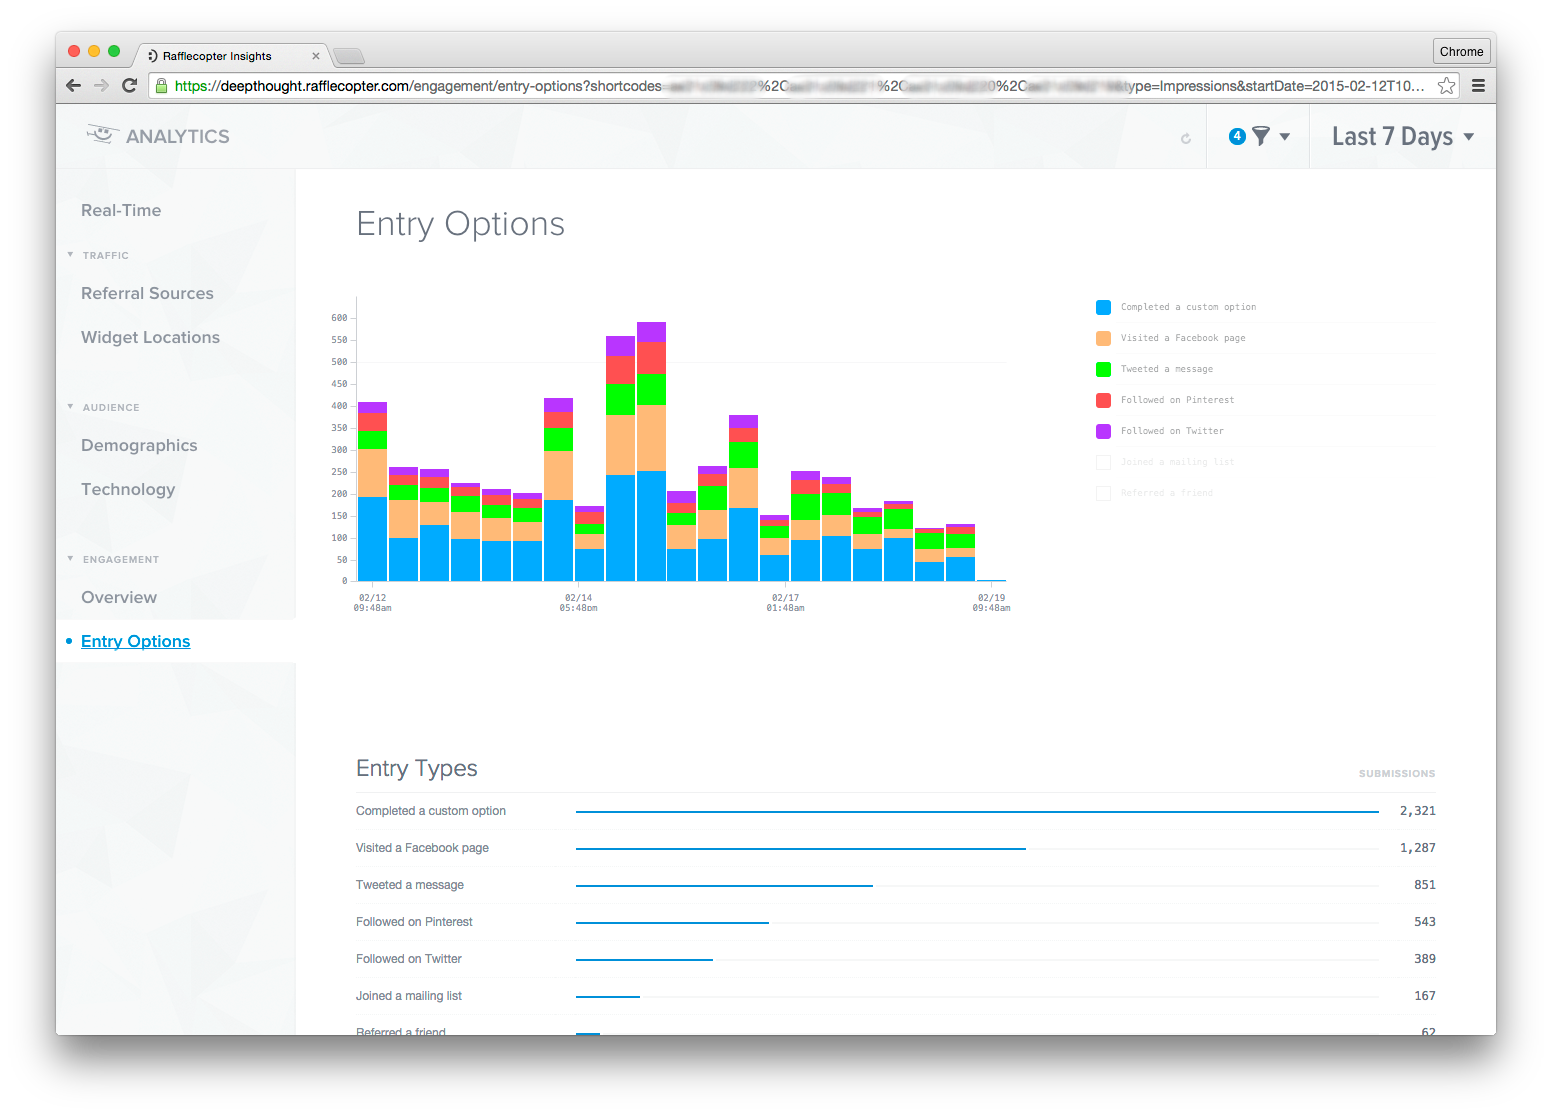
Entry options. See what entry options have been popular in your giveaways. Here you’ll be able to see info behind options that have the most entries, how many entrants have been referred to your giveaway by other entrants, etc.
Final Notes & Updates
One fantastic aspect of the new analytics dashboard that ties everything together is that you can sort and filter by giveaways and dates at the top right of your analytics dashboard. That means you’ll be able to look at the analytics of multiple giveaways in a single view. Select date ranges to compare past giveaways to promotions that are currently running.
We can’t wait to hear what you think! As a new product release, you can expect to see improvements and updates as it’s used more and more, so feedback is welcome :)


Pingback: 5 Giveaway Components You Should Be Testing()
Pingback: Become a Better Marketer With This Giveaway Data()
Pingback: How to Regroup After a Bombed Giveaway | Rafflecopter()