
Is it just me, or do you wake up in the morning, jump out of bed and go straight to your Google Analytics dashboard to see how well your blog or website performed yesterday? If not, we’ll show you in this post why you should work towards progressing beyond being a Google Analytics newbie with your website.
Think for a minute what the availability of data has done for understanding your visitors, prospects, and customers. Let’s take a look at a couple of simple examples.
Authors are generally writing long-form content for their readers. An author who publishes a print book will have some sense of its success by looking at the number of copies that it sells, but beyond that, it’s tough to get too granular on what specific characters, content, or storylines really resonated with the reader.
An author with a website on which they might blog about storylines or characters they are working on, or even post short stories that might represent a chapter, can use web analytics to determine the relative popularity of different content pieces.
If you’re a blogger, there are certainly posts you’ve written and content you’ve posted that resonated a lot more than other posts. But how much more? And what specific parts of those posts’ content made them so popular? With web analytics, this kind of information is relatively easy to interpret.
A small time investment will pay off big time in the form of more targeted content for your readers, more time each visitor spends on your blog, and a bigger audience. Does that work for you? Let’s get started…
Reports for the Google Analytics Newbie
Let’s take a look at a few easy-to-set-up reports in Google Analytics you can use to help create a better user experience for your visitors to turn them into repeat visitors and customers.
Step 1. Install Google Analytics on your website
Why?
- It’s free and one of the most powerful and flexible (free or paid) web analytics tool on the market.
- It can only take a few minutes each day to check in, once you do some simple setup. We’ll show you how below.
- Did I mention?…It’s FREE.
Step 2. Read this to learn how to set up Google Analytics.
Step 3. Read this to learn about a free course on learning Google Analytics.
Step 4. Look at a few reports to get amazing insight into your site visitors’ behavior.
OK, actually, you can skip steps 2 and 3 if you want to dive right into the data. But, I’d recommend coming back to those steps at some point to make the most of your analysis efforts. Here are three reports you can look at in Google Analytics to begin understanding your visitors.
1. Visits (and unique visitors)
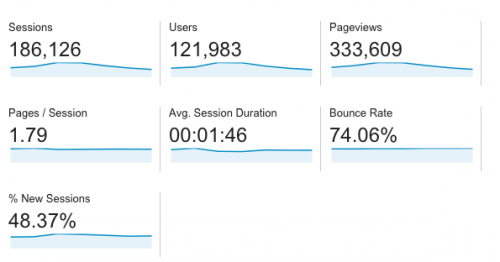
In Google Analytics, visits are called Sessions and unique visitors are called Users. These metrics are the foundation for pretty much everything you care about—how many people are visiting your blog or website and what they’re doing once they get there.
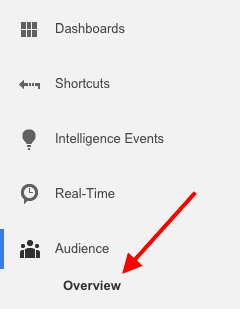
There is a standard report in Google Analytics under the Audience header called Overview, which will show you the total number of Sessions and Users (along with some other great information)
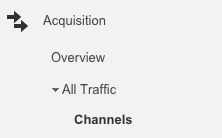
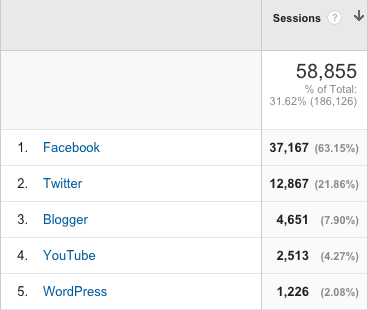
Advanced Tip: View your visitors by traffic source. Head on over to another standard report under the Acquisition header called Channels in the All Traffic menu to see where all those people are coming from in addition to the percentage of new visits from each source.
Action step: Click the “Social” Grouping and use this data to determine how you distribute your blog content. Is Facebook driving more new visitors than other channels? Maybe it’s time to think about increasing your marketing efforts through that channel.
2. Bounce Rate
Bounce rate in Google Analytics (and pretty much any web analytics platform) is defined as a visitor who views one page on your site, then leaves. A high bounce rate can indicate that visitors came to your site (the home page or any other page), didn’t see anything else they wanted to do besides view the page they landed on, and left. Ouch.
The Bounce Rate is available on a couple different reports. One location is in the Overview report under the Behavior section.

Advanced tip: Head on over to the Mobile report under Audience and click on Overview. One of the things this report will show you is the bounce rate across desktop, mobile and tablets. Is the bounce rate on mobile devices much higher than on desktop? This could be an indication your blog isn’t optimized for mobile viewing. In this same report, you can see the percentage of visits that were from a mobile device. If it’s a significant percentage, it’s time to make sure your blog is mobile optimized.
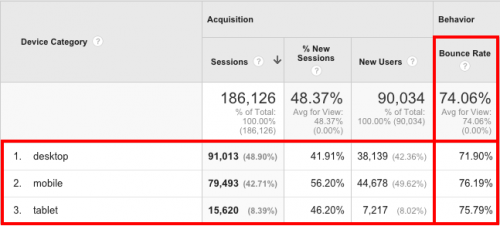
Action step: Think about how you can get visitors to consume more than one page of your website. Some things to try include:
- Link to other relevant blog posts and pages from within your posts.
- Feature your most popular blog posts in the sidebar.
- Include a contextual call-to-action at the bottom of each blog post that gives the reader someplace to go once they finish reading.
3. Most popular content
Trying to figure out what to write about next? Find out what’s most interesting to your readers by looking at the content report. Navigate to the Site Content report under the Behavior tab and click on All Pages, which will show you, among other things, the total number and unique number of pageviews for every page on your site.
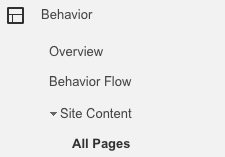
Oh, and remember that bounce rate metric? This report will also show you the bounce rate (and exit rate—the percentage of visitors who left your site from a particular page) for each page, which is super helpful to see which pages and content aren’t holding your visitors’ attention.

Advanced tip: OK, time to get fancy. First off, go read our blog post on UTM parameters and best practices, which will help you control how to tell Google Analytics where your visitors are coming from, which will, in turn, make the report I’m going to show you much more valuable.
Starting from the All Pages report we looked at earlier, click on Secondary Dimension at the top of the Page column. Search for the Source/Medium dimension, and boom! You have a list of the most popular pages on your site, along with how they arrived at your site.
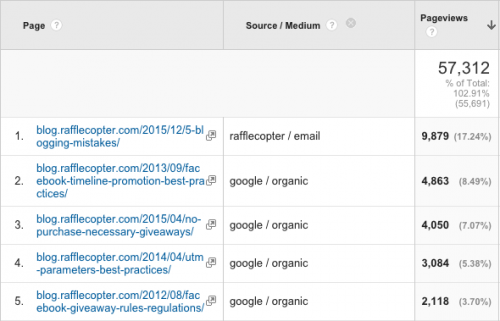
Action step: Sort the data by bounce rate, highest to lowest, by clicking on the Bounce Rate header. You could also do this for the Exit Rate column. In both cases, this will show you which pages you are losing the most visitors from, and you can then develop a plan for how to keep them on your site.
Tip—you may see lots of 100% values for pages that only have 1 or 2 pageviews. It’s most helpful to use a pageview threshold that filters out these low pageviews. To do this:
- Click on the Advanced link next to the search box.
- Change from Include to Exclude.
- Select the dropdown menu that says Page and search for Pageviews.
- After selecting Pageviews, select a value that makes sense for your site and make sure the operator says “less than”. It may take some experimentation with this number to find a pageview threshold that makes sense for you.
![]()
Consider this Google Analytics 101. There is so much more you can do with Google Analytics to learn about your visitors. To be notified when we publish additional posts on Google Analytics, and other marketing topics, go ahead and subscribe here.
Do you have any favorite Google Analytics reports you’re already using? Share them with the community in the comments below, or let us know if we can answer any questions.