There are lots of great reasons to run a giveaway for your business. Audience growth and engagement are two of the most common we hear from our customers. OnePlus grew their mailing list during their One Plus One product launch and the Colorado Tourism Office reached over 400,000 people during their promotion.
There’s another great reason to run giveaways that requires almost no extra work yet provides a ton of value. Your giveaway data.
We covered a few specific ways to use the entrant information in this piece on post giveaway best practices for email and retargeting campaigns. Now let’s take the data available from your giveaway one step further.
We run a monthly giveaway and the data we use in this post is taken from our May giveaway. We’ll cover two specific sources of data and how you can use metrics available from each source, Google Analytics and Rafflecopter Analytics.
Google Analytics
Google Analytics is a powerful tool (and free!) that allows you to collect valuable information about your website and it’s visitors. We put together some tips on how to become Google Analytics Certified which is time well invested if you want to gain a deep understanding of who your website visitors are and how they behave on your site.
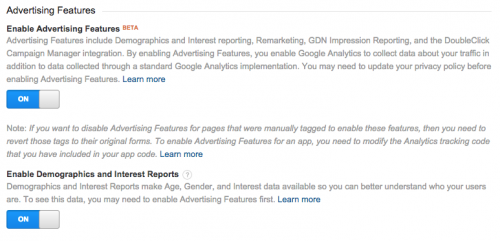
In order to collect and view the data referenced below, you’ll first need to enable Demographic and Interest reports for your Google Analytics property and may also need to enable Advertising Features.
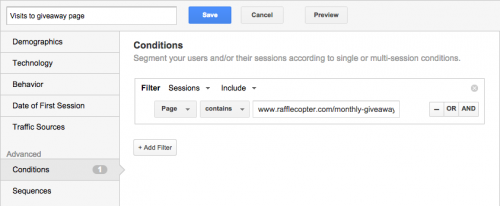
Once this is done and data is being collected you can create a new segment that only includes visits to your giveaway and promotions pages and apply it to the reports covered below.
Data point: Age and Gender
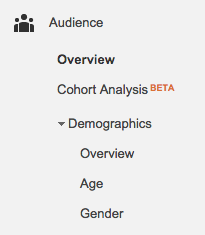
How to use it: Age and Gender reports are available under the Audience | Demographics section of Google Analytics. Knowing the gender makeup and age cohorts will give you great baseline knowledge on your website visitors.
Data point: Affinity Category as defined by Google, “are used to reach potential customers, to make them aware of your brand or product. These are users higher in the purchase funnel, near the beginning of the process.”
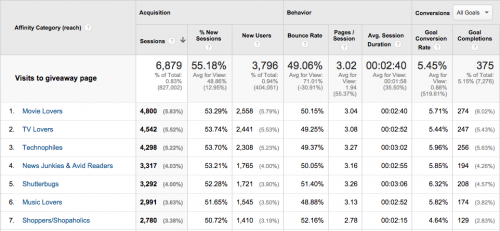
How to Use it: The Affinity Categories report is available under the Audience | Interests section of Google Analytics. Combining Affinity Categories with other data Google Analytics collects will give you great insight into your visitors who are closer to the beginning of the purchase process.
For example, in the sample report below from Google Analytics, the conversion rate for Technofiles and Shutterbugs is higher than Home Decor Enthusiasts and Shoppers. This can help inform everything from the voice and tone of your website and ad copy, to the advertising channels used.
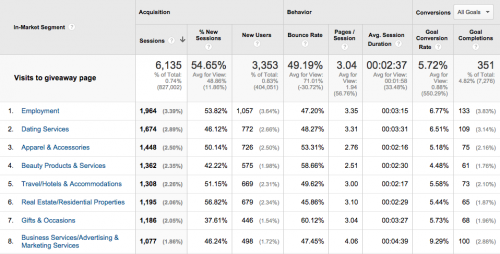
Data Point: In-Market Segment as defined by Google are “users in these segments are more likely to be ready to purchase products or services in the specified category. These are users lower in the purchase funnel, near the end of the process”.
How to Use it: The In-Market Segment report is available under the Audience | Interests section of Google Analytics. Just like the Affinity Categories discussed above, you can combine the In-Market Segment data with other information Google Analytics collects to optimize marketing and promotion efforts to those who are closer to the end of the purchase process.
For example, in the sample report below from Google Analytics, the conversion rate for the Business Services/Advertising & Marketing Services is double that of Beauty Products & Services. This data tells us we probably want to focus on creating content and target advertising channels that align with this group.
Data Point: New vs Returning visitors
How to Use it: After applying the segment for your giveaway visitors, the New vs Returning visitors report will give you insight into not only the ratio of new vs returning visitors, but also their behavior on giveaway pages (bounce rate and average session duration) plus goal completions and conversion rate.
Rafflecopter Analytics
A few months ago we released a beta version of Rafflecopter Analytics. Here are a few of the ways you can use your giveaway data.
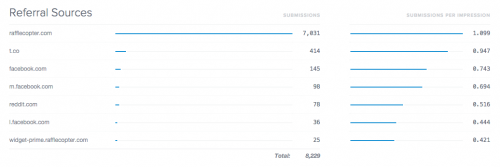
Data point: Referral sources tell you where your giveaway traffic is coming from.
How to Use it: Sites that are sending a significant amount of traffic to your giveaway can be great potential partners for opportunities like guest blogging, advertising, and other marketing efforts since it’s likely that the two sites share similar audiences.
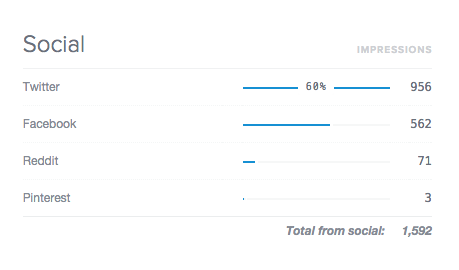
Data point: Social sources will tell you which social channels send the most traffic to your giveaway
How to use it: Rather than invest time in every social channel out there, focus your resources (both paid and unpaid) on the social networks where your customers and prospects are.
Data point: Campaigns
How to use it: If you aren’t already using UTM parameters to tag your campaigns we’ve got you covered. In short, the utm_campaign parameter can be added to a URL and when someone clicks on that URL it tells Google Analytics (and several other analytics tools) how to categorize where that visitor came from. While promoting your giveaway add the utm_campaign tag to help identify what works best.
Data point: The Rafflecopter Analytics Engagement report shows the most popular day and time your giveaway receives entries.
How to use it: Knowing when your customers, fans and visitors tend to engage with you can help inform when to send other communications for maximum impact. For example, when to send email campaigns or post to social networks.
Data point: The Entry Options report in Rafflecopter Analytics will give you a breakdown of how many entries the giveaway received from each type. You could also export your data from the Entries tab on your giveaway to a CSV file and segment the entry options in your spreadsheet program of choice.
How to use it: There are lots of possibilities here. If your entry options include following you on Twitter and Pinterest plus visiting your Facebook page, then comparing how many entries came from each option can provide insight on which social networks to concentrate on.
Using the Poll entry option or Invent your own allows you to collect virtually any piece of data that could help you learn more about your customers, fans and visitors. For example, a poll can be used to ask entrants opinion of a product feature or new website design.
But wait, there’s more!
Once you created the custom segment for visitors to your giveaway pages, you can leverage all the reports that Google Analytics offers! Do some exploring and let us know in the comments below what other reports you find helpful.
